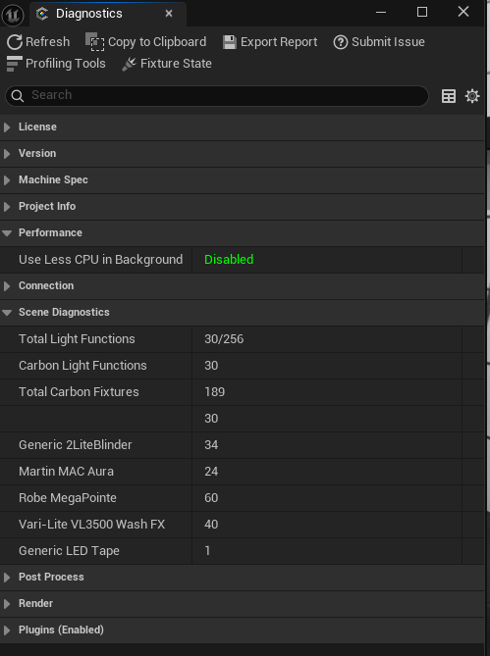
Diagnostics Panel
The Diagnostics Panel provides comprehensive information about your license, machine, and scene.

Refresh
Updates the readouts in the diagnostic panel if you make a change that is not dynamically detected
Copy to Clipboard
Copy the contents of the diagnostics panel into your operating system clipboard for viewing in other applications
Export Report
This allows you to save a .txt file which is especially helpful to our developers when you submit support tickets
Submit Issue
Carbon offers easy support access with the “Submit Issues” button that allows you to submit tickets to our developers.
Profiling Tools
Opens the Carbon Profiling Panel to help with diagnosing performance issues

Fixture State
Opens the fixture state viewer. This panel displays light function and other parametric data for the selected fixture during play mode. Simply select fixtures in the outliner after initiating play.

